Big Data Basics - Part 1 - Introduction to Big Data
Problem
I have been hearing the term Big Data for a while now and would like to know more about it. Can you explain what this term means, how it evolved, and how we identify Big Data and any other relevant details?Solution
Big Data has been a buzz word for quite some time now and it is catching popularity faster than pretty much anything else in the technology world. In this tip, let us understand what this buzz word is all about, what is its significance, why you should care about it, and more.What is Big Data?
Wikipedia defines "Big Data" as a collection of data sets so large and complex that it becomes difficult to process using on-hand database management tools or traditional data processing applications.In simple terms, "Big Data" consists of very large volumes of heterogeneous data that is being generated, often, at high speeds. These data sets cannot be managed and processed using traditional data management tools and applications at hand. Big Data requires the use of a new set of tools, applications and frameworks to process and manage the data.
Evolution of Data / Big Data
Data has always been around and there has always been a need for storage, processing, and management of data, since the beginning of human civilization and human societies. However, the amount and type of data captured, stored, processed, and managed depended then and even now on various factors including the necessity felt by humans, available tools/technologies for storage, processing, management, effort/cost, ability to gain insights into the data, make decisions, and so on.Going back a few centuries, in the ancient days, humans used very primitive ways of capturing/storing data like carving on stones, metal sheets, wood, etc. Then with new inventions and advancements a few centuries in time, humans started capturing the data on paper, cloth, etc. As time progressed, the medium of capturing/storage/management became punching cards followed by magnetic drums, laser disks, floppy disks, magnetic tapes, and finally today we are storing data on various devices like USB Drives, Compact Discs, Hard Drives, etc.
In fact the curiosity to capture, store, and process the data has enabled human beings to pass on knowledge and research from one generation to the next, so that the next generation does not have to re-invent the wheel.
As we can clearly see from this trend, the capacity of data storage has been increasing exponentially, and today with the availability of the cloud infrastructure, potentially one can store unlimited amounts of data. Today Terabytes and Petabytes of data is being generated, captured, processed, stored, and managed.
Characteristics of Big Data - The Three V's of Big Data
When do we say we are dealing with Big Data? For some people 1TB might seem big, for others 10TB might be big, for others 100GB might be big, and something else for others. This term is qualitative and it cannot really be quantified. Hence we identify Big Data by a few characteristics which are specific to Big Data. These characteristics of Big Data are popularly known as Three V's of Big Data.The three v's of Big Data are Volume, Velocity, and Variety as shown below.
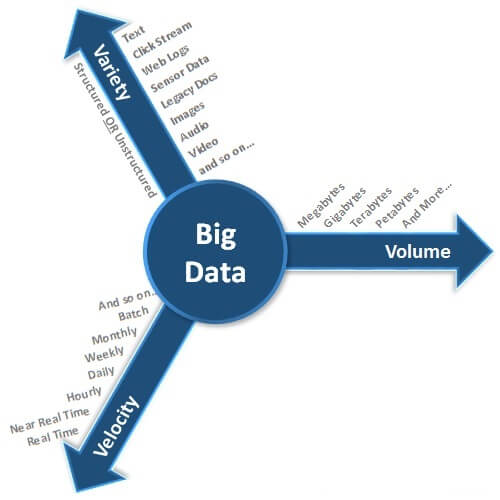
Volume
Volume refers to the size of data that we are working with. With the advancement of technology and with the invention of social media, the amount of data is growing very rapidly. This data is spread across different places, in different formats, in large volumes ranging from Gigabytes to Terabytes, Petabytes, and even more. Today, the data is not only generated by humans, but large amounts of data is being generated by machines and it surpasses human generated data. This size aspect of data is referred to as Volume in the Big Data world.Velocity
Velocity refers to the speed at which the data is being generated. Different applications have different latency requirements and in today's competitive world, decision makers want the necessary data/information in the least amount of time as possible. Generally, in near real time or real time in certain scenarios. In different fields and different areas of technology, we see data getting generated at different speeds. A few examples include trading/stock exchange data, tweets on Twitter, status updates/likes/shares on Facebook, and many others. This speed aspect of data generation is referred to as Velocity in the Big Data world.Variety
Variety refers to the different formats in which the data is being generated/stored. Different applications generate/store the data in different formats. In today's world, there are large volumes of unstructured data being generated apart from the structured data getting generated in enterprises. Until the advancements in Big Data technologies, the industry didn't have any powerful and reliable tools/technologies which can work with such voluminous unstructured data that we see today. In today's world, organizations not only need to rely on the structured data from enterprise databases/warehouses, they are also forced to consume lots of data that is being generated both inside and outside of the enterprise like clickstream data, social media, etc. to stay competitive. Apart from the traditional flat files, spreadsheets, relational databases etc., we have a lot of unstructured data stored in the form of images, audio files, video files, web logs, sensor data, and many others. This aspect of varied data formats is referred to as Variety in the Big Data world.Sources of Big Data
Just like the data storage formats have evolved, the sources of data have also evolved and are ever expanding. There is a need for storing the data into a wide variety of formats. With the evolution and advancement of technology, the amount of data that is being generated is ever increasing. Sources of Big Data can be broadly classified into six different categories as shown below.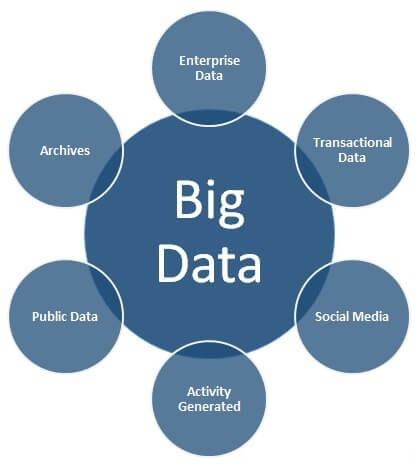
Enterprise Data
There are large volumes of data in enterprises in different formats. Common formats include flat files, emails, Word documents, spreadsheets, presentations, HTML pages/documents, pdf documents, XMLs, legacy formats, etc. This data that is spread across the organization in different formats is referred to as Enterprise Data.Transactional Data
Every enterprise has some kind of applications which involve performing different kinds of transactions like Web Applications, Mobile Applications, CRM Systems, and many more. To support the transactions in these applications, there are usually one or more relational databases as a backend infrastructure. This is mostly structured data and is referred to as Transactional Data.Social Media
This is self-explanatory. There is a large amount of data getting generated on social networks like Twitter, Facebook, etc. The social networks usually involve mostly unstructured data formats which includes text, images, audio, videos, etc. This category of data source is referred to as Social Media.Activity Generated
There is a large amount of data being generated by machines which surpasses the data volume generated by humans. These include data from medical devices, censor data, surveillance videos, satellites, cell phone towers, industrial machinery, and other data generated mostly by machines. These types of data are referred to as Activity Generated data.Public Data
This data includes data that is publicly available like data published by governments, research data published by research institutes, data from weather and meteorological departments, census data, Wikipedia, sample open source data feeds, and other data which is freely available to the public. This type of publicly accessible data is referred to as Public Data.Archives
Organizations archive a lot of data which is either not required anymore or is very rarely required. In today's world, with hardware getting cheaper, no organization wants to discard any data, they want to capture and store as much data as possible. Other data that is archived includes scanned documents, scanned copies of agreements, records of ex-employees/completed projects, banking transactions older than the compliance regulations. This type of data, which is less frequently accessed, is referred to as Archive Data.Formats of Data
Data exists in multiple different formats and the data formats can be broadly classified into two categories - Structured Data and Unstructured Data.Structured data refers to the data which has a pre-defined data model/schema/structure and is often either relational in nature or is closely resembling a relational model. Structured data can be easily managed and consumed using the traditional tools/techniques. Unstructured data on the other hand is the data which does not have a well-defined data model or does not fit well into the relational world.
Structured data includes data in the relational databases, data from CRM systems, XML files etc. Unstructured data includes flat files, spreadsheets, Word documents, emails, images, audio files, video files, feeds, PDF files, scanned documents, etc.
Big Data Statistics
- 100 Terabytes of data is uploaded to Facebook every day
- Facebook Stores, Processes, and Analyzes more than 30 Petabytes of user generated data
- Twitter generates 12 Terabytes of data every day
- LinkedIn processes and mines Petabytes of user data to power the "People You May Know" feature
- YouTube users upload 48 hours of new video content every minute of the day
- Decoding of the human genome used to take 10 years. Now it can be done in 7 days
- 500+ new websites are created every minute of the day
In this tip we were introduced to Big Data, how it evolved, what are its primary characteristics, what are the sources of data, and a few statistics showing how large volumes of heterogeneous data is being generated at different speeds.
References
Next Steps
- Explore more about Big Data. Do some of your own searches to see what you can find.
- Stay tuned for future tips in this series to learn more about the Big Data ecosystem.


