Thursday 31 July 2014

Compare Big Data Platforms vs SQL Server

Compare Big Data Platforms vs SQL Server

Problem

SQL is derided by modern developers as 'Scarcely Qualifies as a Language'. But just how efficient are the new wave of NoSQL languages touted by bleeding-edge skunk works? This tip is a defense of SQL and of the relational model, and argues for the efficiency and suitability of relational technology.  Check out this tip to learn more.

Solution

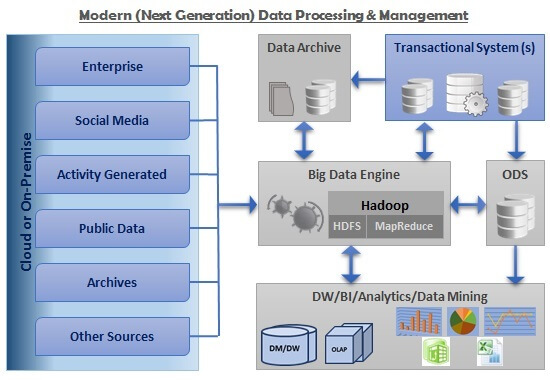
SQL, or Structured Query Language, is one of the most versatile tools that an information analyst can use when working with relational databases. Initially developed around 40 years ago as an application of the mathematical theories of Codd, Boyce and others, it has since been embraced by the information technology industry and transformed into a range of dialects for a variety of platforms. With the core syntax and features reflected in easy-to-remember heuristics (SELECT, INSERT, UPDATE, DELETE), its popularity has soared and over the last twenty years, three vendors have come to the fore: Microsoft, with SQL Server; Oracle, with Oracle Database; and MySQL, developed by Sun and now also owned by Oracle.

However, as astute readers of technology blogs may know, Big Data has come galloping onto the horizon. Arguably, the applications of Big Data originated (in recent times) with Google's MapReduce algorithms, and it has evolved with tremendous speed into a range of products: Node.js, Hadoop, MongoDB, RavenDB and more. Searching Google, one can find multitudes of articles expounding the benefits of Big Data. Marketers, long deprived of sexy sales slogans for 'boring' relational databases, have taken the term to heart, with the result that Big Data is now not only the 'next big thing' but is being touted as the only way forward in the shiny new 'Information Age'. Companies are being exhorted to use these new tools to leverage their existing data and expand their businesses in ways they have never been able to before.

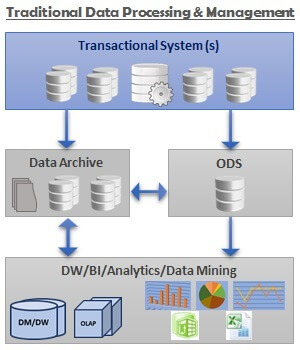
Storage Format for Relational Databases vs. NoSQL

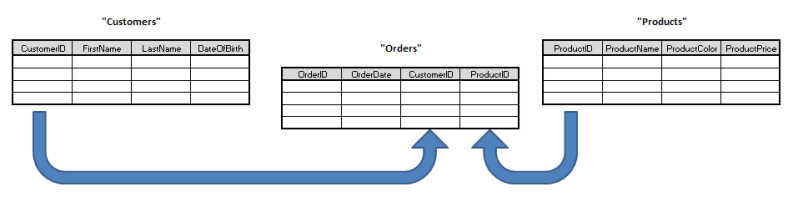
So, what's the difference between relational data and non-relational data - or SQL, and NoSQL (aka NewSQL)? Relational data is defined at the basic level by a series of table entities which contain columns and rows, linked to other table entities by shared attributes. So, for example, as the owner of a small online business you might have a MySQL database behind your website with a table recording the name and email address of your customers. Another table might record your product names and their prices. A third table might link the two, recording which customers bought which products, with additional information such as the date of purchase and whether or not any discount was applied.
You can quickly see how this information could be useful; some analysis will give you the average spend per customer; a list of regular customers, and a list of inactive ones; a list of the most popular products. From this simple data you can make good business decisions: you can tempt back inactive customers with a targeted email campaign, you can adjust your stock to prioritize the most popular products. The possibilities are endless. At the core level, these queries against your data are performed in SQL, although various tools exist to hide this from the casual user.

Non-relational data, however, is not (by and large) stored in tables. Often called 'unstructured data', this data consists of separate records with attributes that vary, often per record. Say, for example, your small online business was a dating website recording, from a web page, the interests and ambitions of your members. Due to the huge variety of interests, you might wish to store each member as a document with the interests, and any attributes of those interests, laid out hierarchically. Relational databases are no good for this purpose - an 'Interests' table might list every conceivable interest, but recording an unknown number and combination of interests against each member forces the relational model to expand in ways it wasn't designed for. Standards such as XML and JSON, however, with variable nodes and node attributes, can be ideal since each record is stored uniquely with complex algorithms used for analysis and presentation.
Relational Data - Example Table Structure
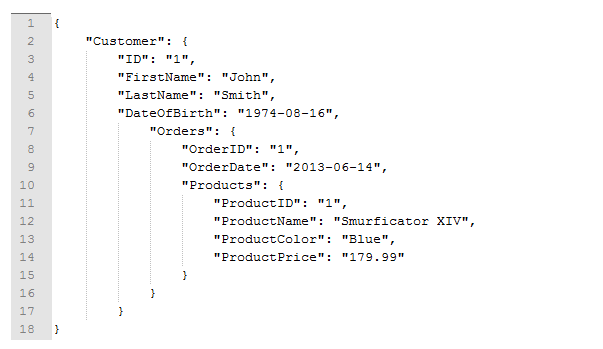
NoSQL - Example Record in JSON

Data Variation

So Big Data is all very well when dealing with unstructured data. When caching common Google queries, or recording masses of highly-variable customer-centric information, the technologies that use it can perform well. But what about the majority of businesses? How often will their data structures change? After all, most online merchants will have customers, products, sales, suppliers, etc. In terms of the variation of the data - the measure of how the structure of data is subject to change over time - most merchants, through the very nature of business, will find they're working to a fairly static data model.

After all, if you are a curtain manufacturer, your products will all have identical attributes - color, width, drop, price, fabric, style, thickness, etc. If you're a factory selling ball bearings, your ball bearings will have similar properties - diameter, density, material, price, quantity per batch, etc. These attributes are not likely to expand over time, and any expansion would take place within the data facts, rather than the data dimensions - say, for example, a new type of metal alloy was invented, this alloy would be added as a row in the materials table, rather than as a column in the products table.

So if we accept the argument that the rate of data variation is low amongst most businesses, then how important is the rise of Hadoop, Node.js, MongoDB/RavenDB and all the other NoSQL platforms? Is the rise of NoSQL simply the public perception of an inflated marketing bubble? We can argue that for OnLine Transaction Processing (OLTP) systems, which match the requirements for most businesses, NoSQL is not the right tool for the job.

Searching for Data

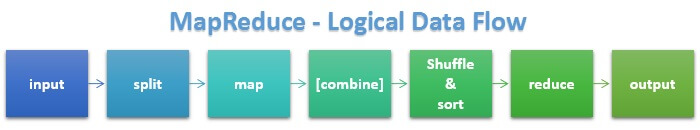
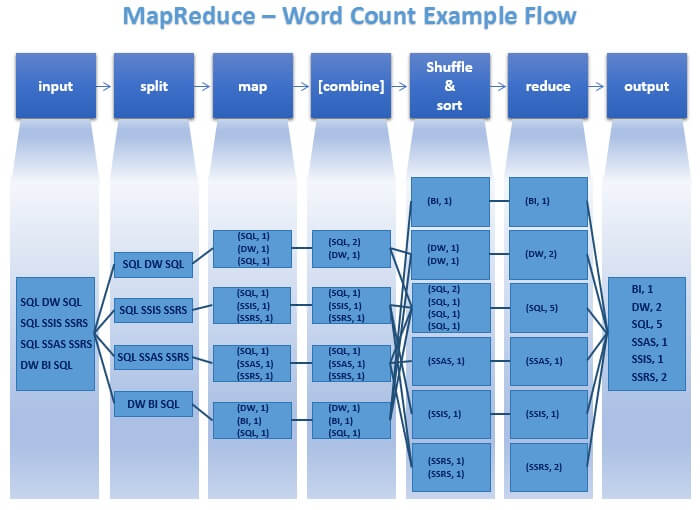
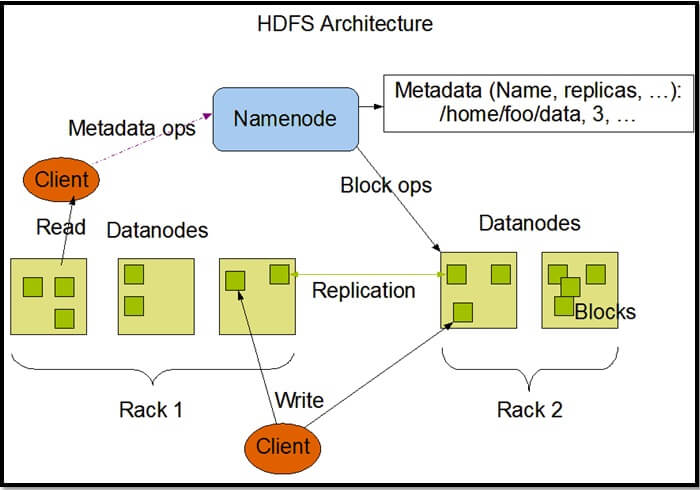
Let's now look at the algorithms for searching for data. Under a NoSQL data model, such as Hadoop, there exist a number of variations on a theme (and you can write your own) for searching for data using the MapReduce paradigm. This paradigm is that a typical analysis task, such as a series of read requests, is sent out to multiple nodes - servers - where the data resides. Each subset of the total request collects the data from the local data source, before a reduction algorithm aggregates and reduces the data to produce the desired result set. Some thought will show this approach works for certain types of unstructured data - for example, for string-searching unstructured tweets.

However, for more structured data, this approach is flawed. Structured data tends to be held in central repositories rather than 'sharded' across multiple servers, and under a relational model searching for data is extremely efficient. For example, in Microsoft SQL Server the search algorithm can approach a pre-sorted table (a table using a clustered index based on a balanced-tree format) and search for particular values using this index, and/or additional indexes (think of them like overlays to the data) to locate and return the data. I'll skip the mathematics here, but many millions of records can hence be reduced to a b-tree search problem so that a single- or double-digit number of reads are required to return the desired data. In addition, partitioning can replicate some of the performance benefits of sharding, since sharding is horizontal partitioning except distributed across servers.

Reads and Writes

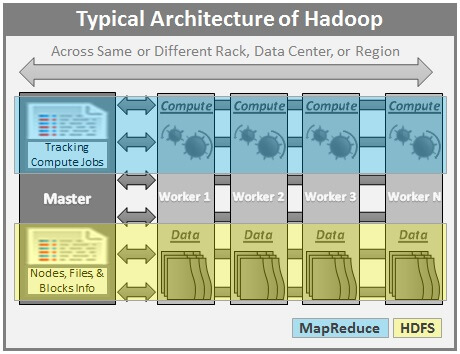
Carrying on with this theme, Big Data platforms such as Hadoop are acknowledged to be quicker at writes than relational databases. Why? Because in Hadoop, writes are 'thrown over the fence' asynchronously with no wait on the commit from the database engine. In relational systems, a write is an atomic, consistent, isolated, durable (ACID) transaction and only completes on commit - hence synchronous in it's very nature. This can cause unnecessary delays for applications that don't wish to wait for commit acknowledgement. Hadoop easily outperforms relational systems here, for the sheer asynchronism of the process.

But what about reads? As argued above, reads take much longer, since the result set must be located (through mapping key-value pairs) then reduced across multiple nodes. Take a look at the JSON record in the image above - locating every unique product bought in interval X to Y would require a search on every customer record. If there are thousands of customers for a dozen products, this is extremely wasteful. Using a relational table, the query is broken down, optimized, filtered and returned much quicker. With relational systems, efficient structured reads (even on heaps, which tend to have sequential data stored on adjacent disk pages) can take place resulting in returns in the order of milliseconds, even for large result sets. Indeed, often the client application takes longer to render the result set than the server takes to supply it!

Total Cost of Ownership

'But it's FREE!', comes the wail from the IT manager. Is it? Apache Hadoop, to take an example, is indeed free at the point of use. The Apache Foundation have released Hadoop as open-source, so anyone can view the source code and see how it works. Anyone can download it. There's no core licensing fees. However, this doesn't mean it doesn't cost anything. The servers on which Hadoop must reside do indeed cost money. And as Big Data platforms are designed to scale out, rather than scale up, you'll need more and more servers to service your data requirements. Whereas production database systems servicing major businesses (and I can name a few) can sit on just a handful of relational database servers, Hadoop platforms are designed for large clusters of nodes and if you can't afford them - Hadoop may not be for you.

'Just use commodity hardware!', is the next argument. Really - tie together hundreds of old PCs or battered low-rent servers in a crazy Beowulf-like cluster? Not only does this present major headaches when considering the long-term costs of storage, cooling, maintenance, this simply isn't viable for small- to mid-size businesses. The fact is that the TCO for a Big Data platform is simply too high, even when compared with Microsoft's frankly appalling licensing costs (for SQL Server). There is a third way - using an open-source relational platform, such as MySQL, but there are some missing features when compared against larger offerings and there's still the cost of support. However some notable names out there use MySQL - Facebook being the largest, and for certain applications this may be a suitable compromise.

Object-Relational Mapping

ORM, better known amongst DBAs and relational database developers as 'Object-Relational Mangling', is an umbrella term for a number of new tools that allow developers to call a connection to a database as an object, and interact with that object using pre-set methods. The ORM tool (such as nHibernate) will then translate the method call into a SQL query, which is sent to the database for processing. The result set is then returned to the entity that called the method. Since object-oriented programming does not play nicely with the relational model, there are inevitably some challenges when ORM tools generate SQL code. For example, nHibernate will generate large (sometimes, hundreds) of parameters to feed into a parameterized statement. This makes the resulting automatically generated statements hard to optimize, filling the plan cache (optimizer feature) in SQL Server with hundreds of ad-hoc plans, meaning increased delay in server response time thanks to increased I/O.

On the flip side, modern developers normally use object-oriented methods to develop new tools, and calling a method on a connection object, passing in input parameters to return a result set, is natural and fits with the paradigm of method calls for the other 'black-box' features or libraries used in their languages. From the developer perspective, the ideal is to call a method with, for example, a customer number and return some attributes of that customer from the database into a result set. Under the relational-only model, they would need to either roll their own method that dynamically builds the query based on input parameters, or use in-line SQL queries, which is bad coding practice. Products such as nHibernate help bridge the gap by providing that level of translation to the relational layer.

Right Tool For The Job?

One consistent argument used by developers when attempting to win over the stubborn DBA with NoSQL tooling is that SQL and NoSQL are different toolsets to be used for different purposes. Confusing the two when trying to solve a problem that clearly belongs in the remit of just one platform is equivalent to using a screwdriver to hammer in a nail. But how true is this? Take server logs, for example. An extended log file for IIS 6.0 might contain one or more of the following fields: date, time, c-ip, cs-username, s-ip, s-port, cs-method, cs-uri-stem, cs-uri-query, sc-status, cs(User-Agent), etc. Although the fields are defined in a #comment at the beginning of the file, these fields are unlikely to change through the lifetime of the product. The data recorded is a mixture of date, time, IP address and character fields.

Aggregating results from these logs is simple, and relational systems (with the right indexes) can do this with outstanding performance. In a NoSQL document store, each row is stored as a separate document inside a collection; to get, for example, the called URL from all records matching a particular IP, all documents will need to be scanned (string-searching on attribute), collated then reduced to the subset of data required. This approach is extremely inefficient, but analysis of server logs is frequently touted as a good application of NoSQL technology to real-world data mining.
There is an argument that issues such as the ORM/relational mismatch help provide the justification for a move to a non-relational platform. Various companies have tried it, and anecdotal evidence highlights various problems not just with the migration of data, but the ongoing benefits of it. For example, Foursquare's public apology following their catastrophic attempt to add a shard to their estate which resulted in an 11-hour outage; and the engaging account from Wireclub of the benefits (and pitfalls) of their migration from SQL Server to MongoDB should sound alarm bells with even the most pro-NoSQL DBA or developer - '...not only the database would crash and exit without providing any useful information but the data would also be left in a corrupted state.' (on MongoDB for Windows). However, the companies in both these examples determined NoSQL to be the data platform most suited to their future development as an organization, and they are learning to live with the features unavailable in more sophisticated relational platforms.

In Summary

Relational systems may have been born in the 1970s, but the feature set offered by the more advanced examples of relational platforms far outstrips the feature sets available in NoSQL implementations. Although NoSQL purports to be new, the concepts have been around for more than 20 years; look up 'network databases' and see the striking similarities to modern-day graph databases. The generation before us tried non-relational systems and the concepts simply didn't work - one can see the same story with new Agile and LEAN processes producing rafts of cheap code that's apt to break, versus the SSADM (Big Design Up Front) methodologies that gave us quality systems like our government defense and our banking infrastructure. NoSQL campaigners now say 'not only SQL' rather than 'no SQL' in belated realization that SQL actually has features to offer; these add-ons, such as Hive for Hadoop, provide a SQL-NoSQL translation layer. But the underlying document store, described by a colleague as a 'massive version of Notepad', is inefficient. This failure to build efficacious foundations of the new Information Age will be the undoing of our data-driven systems unless we tackle the structural problems at the heart of these new products, and rebuild them in an economical way.

Next Steps

For further reading on structured and unstructured data storage technologies and expositions on the arguments above, please consult the following sources and read the extensive opinions available on the web:


Big Data Basics - Part 6 - Related Apache Projects in Hadoop Ecosystem

Big Data Basics - Part 6 - Related Apache Projects in Hadoop Ecosystem

Problem

I have read the previous tips in the Big Data Basics series including the storage (HDFS) and computation (MapReduce) aspects. After reading through those tips, I understand that HDFS and MapReduce are the core components of Hadoop. Now, I want to know about other components that are part of the Hadoop Ecosystem.

Solution

In this tip we will take a look at some of the other popular Apache Projects that are part of the Hadoop Ecosystem.

Hadoop Ecosystem

As we learned in the previous tips, HDFS and MapReduce are the two core components of the Hadoop Ecosystem and are at the heart of the Hadoop framework. Now it's time to take a look at some of the other Apache Projects which are built around the Hadoop Framework which are part of the Hadoop Ecosystem. The following diagram shows some of the most popular Apache Projects/Frameworks that are part of the Hadoop Ecosystem.
Apache Hadoop Ecosystem
Next let us get an overview of each of the projects represented in the above diagram.

Apache Pig

Apache Pig is a software framework which offers a run-time environment for execution of MapReduce jobs on a Hadoop Cluster via a high-level scripting language called Pig Latin. The following are a few highlights of this project:
  • Pig is an abstraction (high level programming language) on top of a Hadoop cluster.
  • Pig Latin queries/commands are compiled into one or more MapReduce jobs and then executed on a Hadoop cluster.
  • Just like a real pig can eat almost anything, Apache Pig can operate on almost any kind of data.
  • Hadoop offers a shell called Grunt Shell for executing Pig commands.
  • DUMP and STORE are two of the most common commands in Pig. DUMP displays the results to screen and STORE stores the results to HDFS.
  • Pig offers various built-in operators, functions and other constructs for performing many common operations.
Additional Information: Home Page | Wiki | Documentation/User Guide/Reference Manual | Mailing Lists

Apache Hive

Apache Hive Data Warehouse framework facilitates the querying and management of large datasets residing in a distributed store/file system like Hadoop Distributed File System (HDFS).  The following are a few highlights of this project:
  • Hive offers a technique to map a tabular structure on to data stored in distributed storage.
  • Hive supports most of the data types available in many popular relational database platforms.
  • Hive has various built-in functions, types, etc. for handling many commonly performed operations.
  • Hive allows querying of the data from distributed storage through the mapped tabular structure.
  • Hive offers various features, which are similar to relational databases, like partitioning, indexing, external tables, etc.
  • Hive manages its internal data (system catalog) like metadata about Hive Tables, Partitioning information, etc. in a separate database known as Hive Metastore.
  • Hive queries are written in a SQL-like language known as HiveQL.
  • Hive also allows plugging in custom mappers, custom reducers, custom user-defined functions, etc. to perform more sophisticated operations.
  • HiveQL queries are executed via MapReduce. Meaning, when a HiveQL query is issued, it triggers a Map and/or Reduce job(s) to perform the operation defined in the query.
Additional Information: Home Page | Wiki | Documentation/User Guide/Reference Manual | Mailing Lists

Apache Mahout

Apache Mahout is a scalable machine learning and data mining library. The following are a few highlights of this project:
  • Mahout implements the machine learning and data mining algorithms using MapReduce.
  • Mahout has 4 major categories of algorithms: Collaborative Filtering, Classification, Clustering, and Dimensionality Reduction.
  • Mahout library contains two types of algorithms: Ones that can run in local mode and the others which can run in a distributed fashion.
  • More information on Algorithms: Mahout Algorithms.
Additional Information: Home Page | Wiki | Documentation/User Guide/Reference Manual | Mailing Lists

Apache HBase

Apache HBase is a distributed, versioned, column-oriented, scalable and a big data store on top of Hadoop/HDFS. The following are a few highlights of this project:
  • HBase is based on Google's BigTable concept.
  • Runs on top of Hadoop and HDFS in a distributed fashion.
  • Supports Billions of Rows and Millions of Columns.
  • Runs on a cluster of commodity hardware and scales linearly.
  • Offers consistent reads and writes.
  • Offers easy to use Java APIs for client access.
Additional Information: Home Page | Wiki | Documentation/User Guide/Reference Manual | Mailing Lists

Apache Sqoop

Apache Sqoop is a tool designed for efficiently transferring the data between Hadoop and Relational Databases (RDBMS). The following are a few highlights of this project:
  • Sqoop can efficiently transfer bulk data between HDFS and Relational Databases.
  • Sqoop allows importing the data into HDFS in an incremental fashion.
  • Sqoop can import and export data to and from HDFS, Hive, Relational Databases and Data Warehouses.
  • Sqoop uses MapReduce to import and export of data thereby effectively utilizing the parallelism and fault tolerance features of Hadoop.
  • Sqoop offers a command line commonly referred to as Sqoop command line.
Additional Information: Home Page | Wiki | Documentation/User Guide/Reference Manual | Mailing Lists

Apache Oozie

Apache Oozie is a job workflow scheduling and coordination manager for managing the jobs executed on Hadoop. The following are a few highlights of this project:
  • Oozie can include both MapReduce as well as Non-MapReduce jobs.
  • Oozie is integrated with Hadoop and is an integral part of the Hadoop Ecosystem.
  • Oozie supports various jobs out of the box including MapReduce, Pig, Hive, Sqoop, etc.
  • Oozie jobs are scheduled/recurring jobs and are executed based on scheduled frequency and availability of data.
  • Oozie jobs are organized/arranged in a Directed Acyclic Graph (DAG) fashion.
Additional Information: Home Page | Wiki | Documentation/User Guide/Reference Manual | Mailing Lists

Apache ZooKeeper

Apache ZooKeeper is an open source coordination service for distributed applications. The following are a few highlights of this project:
  • ZooKeeper is designed to be a centralized service.
  • ZooKeeper is responsible for maintaining configuration information, offering coordination in a distributed fashion, and a host of other capabilities.
  • ZooKeeper offers necessary tools for writing distributed applications which can coordinate effectively.
  • ZooKeeper simplifies the development of distributed applications.
  • ZooKeeper is being used by some of the Apache projects like HBase to offer high availability and high degree of coordination in a distributed environment.
Additional Information: Home Page | Wiki | Documentation/User Guide/Reference Manual | Mailing Lists

Apache Ambari

Apache Ambari is an open source software framework for provisioning, managing, and monitoring Hadoop clusters. The following are few highlights of this project:
  • Ambari is useful for installing Hadoop services across different nodes of the cluster and handling the configuration of Hadoop Services on the cluster.
  • Ambari offers centralized management of the cluster including configuration and re-configuration of services, starting and stopping of cluster and a lot more.
  • Ambari offers a dashboard for monitoring the overall health of the cluster.
  • Ambari offers alerting and email mechanism to get the required attention when required.
  • Ambari offers REST APIs to developers for application integration.
Additional Information: Home Page | Wiki | Documentation/User Guide/Reference Manual | Mailing Lists

Conclusion

These are some of the popular Apache Projects. Apart from those, there are various other Apache Projects that are built around the Hadoop framework and have become part of the Hadoop Ecosystem. Some of these projects include
  • Apache Avro - An open source framework for Remote procedure calls (RPC) and data serialization and data exchange
  • Apache Spark - A fast and general engine for large-scale data processing
  • Apache Cassandra - A Distributed Non-SQL Big Data Database

References

Next Steps
  • Explore more about Big Data and Hadoop.
  • Explore more about various Apache Projects.


Big Data Basics - Part 5 - Introduction to MapReduce

Big Data Basics - Part 5 - Introduction to MapReduce

Problem

I have read the previous tips in the Big Data Basics series including the storage aspects (HDFS). I am curious about the computation aspect of Hadoop and want to know what it is all about, how it works, and any other relevant information.

Solution

In this tip we will take a look at the 2nd core component of Hadoop framework called MapReduce. This component is responsible for computation / data processing.

Introduction

MapReduce is basically a software programming model / software framework, which allows us to process data in parallel across multiple computers in a cluster, often running on commodity hardware, in a reliable and fault-tolerant fashion.

Key Concepts

Here are some of the key concepts related to MapReduce.

Job

A Job in the context of Hadoop MapReduce is the unit of work to be performed as requested by the client / user. The information associated with the Job includes the data to be processed (input data), MapReduce logic / program / algorithm, and any other relevant configuration information necessary to execute the Job.

Task

Hadoop MapReduce divides a Job into multiple sub-jobs known as Tasks. These tasks can be run independent of each other on various nodes across the cluster. There are primarily two types of Tasks - Map Tasks and Reduce Tasks.

JobTracker

Just like the storage (HDFS), the computation (MapReduce) also works in a master-slave / master-worker fashion. A JobTracker node acts as the Master and is responsible for scheduling / executing Tasks on appropriate nodes, coordinating the execution of tasks, sending the information for the execution of tasks, getting the results back after the execution of each task, re-executing the failed Tasks, and monitors / maintains the overall progress of the Job.  Since a Job consists of multiple Tasks, a Job's progress depends on the status / progress of Tasks associated with it. There is only one JobTracker node per Hadoop Cluster.

TaskTracker

A TaskTracker node acts as the Slave and is responsible for executing a Task assigned to it by the JobTracker. There is no restriction on the number of TaskTracker nodes that can exist in a Hadoop Cluster. TaskTracker receives the information necessary for execution of a Task from JobTracker, Executes the Task, and Sends the Results back to JobTracker.

Map()

Map Task in MapReduce is performed using the Map() function. This part of the MapReduce is responsible for processing one or more chunks of data and producing the output results.

Reduce()

The next part / component / stage of the MapReduce programming model is the Reduce() function. This part of the MapReduce is responsible for consolidating the results produced by each of the Map() functions/tasks.

Data Locality

MapReduce tries to place the data and the compute as close as possible. First, it tries to put the compute on the same node where data resides, if that cannot be done (due to reasons like compute on that node is down, compute on that node is performing some other computation, etc.), then it tries to put the compute on the node nearest to the respective data node(s) which contains the data to be processed. This feature of MapReduce is "Data Locality".

How Map Reduce Works

The following diagram shows the logical flow of a MapReduce programming model.
Hadoop - MapReduce - Logical Data Flow
Let us understand each of the stages depicted in the above diagram.
  • Input: This is the input data / file to be processed.
  • Split: Hadoop splits the incoming data into smaller pieces called "splits".
  • Map: In this step, MapReduce processes each split according to the logic defined in map() function. Each mapper works on each split at a time. Each mapper is treated as a task and multiple tasks are executed across different TaskTrackers and coordinated by the JobTracker.
  • Combine: This is an optional step and is used to improve the performance by reducing the amount of data transferred across the network. Combiner is the same as the reduce step and is used for aggregating the output of the map() function before it is passed to the subsequent steps.
  • Shuffle & Sort: In this step, outputs from all the mappers is shuffled, sorted to put them in order, and grouped before sending them to the next step.
  • Reduce: This step is used to aggregate the outputs of mappers using the reduce() function. Output of reducer is sent to the next and final step. Each reducer is treated as a task and multiple tasks are executed across different TaskTrackers and coordinated by the JobTracker.
  • Output: Finally the output of reduce step is written to a file in HDFS.

MapReduce Word Count Example

For the purpose of understanding MapReduce, let us consider a simple example. Let us assume that we have a file which contains the following four lines of text.
Hadoop - MapReduce - Word Count Example - Input File
In this file, we need to count the number of occurrences of each word. For instance, DW appears twice, BI appears once, SSRS appears twice, and so on. Let us see how this counting operation is performed when this file is input to MapReduce.
Below is a simplified representation of the data flow for Word Count Example.
Hadoop - MapReduce - Word Count Example - Data Flow
  • Input: In this step, the sample file is input to MapReduce.
  • Split: In this step, Hadoop splits / divides our sample input file into four parts, each part made up of one line from the input file. Note that, for the purpose of this example, we are considering one line as each split. However, this is not necessarily true in a real-time scenario.
  • Map: In this step, each split is fed to a mapper which is the map() function containing the logic on how to process the input data, which in our case is the line of text present in the split. For our scenario, the map() function would contain the logic to count the occurrence of each word and each occurrence is captured / arranged as a (key, value) pair, which in our case is like (SQL, 1), (DW, 1), (SQL, 1), and so on.
  • Combine: This is an optional step and is often used to improve the performance by reducing the amount of data transferred across the network. This is essentially the same as the reducer (reduce() function) and acts on output from each mapper. In our example, the key value pairs from first mapper "(SQL, 1), (DW, 1), (SQL, 1)" are combined and the output of the corresponding combiner becomes "(SQL, 2), (DW, 1)".
  • Shuffle and Sort: In this step, output of all the mappers is collected, shuffled, and sorted and arranged to be sent to reducer.
  • Reduce: In this step, the collective data from various mappers, after being shuffled and sorted, is combined / aggregated and the word counts are produced as (key, value) pairs like (BI, 1), (DW, 2), (SQL, 5), and so on.
  • Output: In this step, the output of the reducer is written to a file on HDFS. The following image is the output of our word count example.
Hadoop - MapReduce - Word Count Example - Output File

Highlights of Hadoop MapReduce

Here are few highlights of MapReduce programming model in Hadoop:
  • MapReduce works in a master-slave / master-worker fashion. JobTracker acts as the master and TaskTrackers act as the slaves.
  • MapReduce has two major phases - A Map phase and a Reduce phase. Map phase processes parts of input data using mappers based on the logic defined in the map() function. The Reduce phase aggregates the data using a reducer based on the logic defined in the reduce() function.
  • Depending upon the problem at hand, we can have One Reduce Task, Multiple Reduce Tasks or No Reduce Tasks.
  • MapReduce has built-in fault tolerance and hence can run on commodity hardware.
  • MapReduce takes care of distributing the data across various nodes, assigning the tasks to each of the nodes, getting the results back from each node, re-running the task in case of any node failures, consolidation of results, etc.
  • MapReduce processes the data in the form of (Key, Value) pairs. Hence, we need to fit out business problem in this Key-Value arrangement.

References

Next Steps

  • Explore more about Big Data and Hadoop
  • In the next and subsequent tips, we will look at the other aspects of Hadoop and the Big Data world. So stay tuned!


Big Data Basics - Part 4 - Introduction to HDFS

Big Data Basics - Part 4 - Introduction to HDFS

Problem

I have read the previous tips in the Big Data Basics series and I would like to know more about the Hadoop Distributed File System (HDFS). I would like to know about relevant information related to HDFS.

Solution

Before we take a look at the architecture of HDFS, let us first take a look at some of the key concepts.

Introduction

HDFS stands for Hadoop Distributed File System. HDFS is one of the core components of the Hadoop framework and is responsible for the storage aspect. Unlike the usual storage available on our computers, HDFS is a Distributed File System and parts of a single large file can be stored on different nodes across the cluster. HDFS is a distributed, reliable, and scalable file system.

Key Concepts

Here are some of the key concepts related to HDFS.

NameNode

HDFS works in a master-slave/master-worker fashion. All the metadata related to HDFS including the information about data nodes, files stored on HDFS, and Replication, etc. are stored and maintained on the NameNode. A NameNode serves as the master and there is only one NameNode per cluster.

DataNode

DataNode is the slave/worker node and holds the user data in the form of Data Blocks. There can be any number of DataNodes in a Hadoop Cluster.

Data Block

A Data Block can be considered as the standard unit of data/files stored on HDFS. Each incoming file is broken into 64 MB by default. Any file larger than 64 MB is broken down into 64 MB blocks and all the blocks which make up a particular file are of the same size (64 MB) except for the last block which might be less than 64 MB depending upon the size of the file.

Replication

Data blocks are replicated across different nodes in the cluster to ensure a high degree of fault tolerance. Replication enables the use of low cost commodity hardware for the storage of data. The number of replicas to be made/maintained is configurable at the cluster level as well as for each file. Based on the Replication Factor, each file (data block which forms each file) is replicated many times across different nodes in the cluster.

Rack Awareness

Data is replicated across different nodes in the cluster to ensure reliability/fault tolerance. Replication of data blocks is done based on the location of the data node, so as to ensure high degree of fault tolerance. For instance, one or two copies of data blocks are stored on the same rack, one copy is stored on a different rack within the same data center, one more block on a rack in a different data center, and so on.

HDFS Architecture

Below is a high-level architecture of HDFS.
Architecture of Multi-Node Hadoop Cluster

Image Source: http://hadoop.apache.org/docs/stable1/hdfs_design.html Here are the highlights of this architecture.

Master-Slave/Master-Worker Architecture

HDFS works in a master-slave/master-worker fashion.
  • NameNode servers as the master and each DataNode servers as a worker/slave.
  • NameNode and each DataNode have built-in web servers.
  • NameNode is the heart of HDFS and is responsible for various tasks including - it holds the file system namespace, controls access to file system by the clients, keeps track of the DataNodes, keeps track of replication factor and ensures that it is always maintained.
  • User data is stored on the local file system of DataNodes. DataNode is not aware of the files to which the blocks stored on it belong to. As a result of this, if the NameNode goes down then the data in HDFS is non-usable as only the NameNode knows which blocks belong to which file, where each block located etc.
  • NameNode can talk to all the live DataNodes and the live DataNodes can talk to each other.
  • There is also a Secondary NameNode which comes in handy when the Primary NameNode goes down. Secondary NameNode can be brought up to bring the cluster online. This process of switching of nodes needs to be done manually and there is no automatic failover mechanism in place.
  • NameNode receives heartbeat signals and a Block Report periodically from each of the DataNodes.
    • Heartbeat signals from a DataNode indicates that the corresponding DataNode is alive and is working fine. If a heartbeat signal is not received from a DataNode then that DataNode is marked as dead and no further I/O requests are sent to that DataNode.
    • Block Report from each DataNode contains a list of all the blocks that are stored on that DataNode.
    • Heartbeat signals and Block Reports received from each DataNode help the NameNode to identify any potential loss of Blocks/Data and to replicate the Blocks to other active DataNodes in the event when one or more DataNodes holding the data blocks go down.

Data Replication

Data is replicated across different DataNodes to ensure a high degree of fault-tolerance.
  • Replication Factor can be configured at a cluster level (Default is set to 3) and also at a file level.
  • The need for data replication can arise in various scenarios like the Replication Factor is changed, a DataNode goes down, and when Data Blocks get corrupted, etc.
  • When the replication factor is increased (At the cluster level or for a particular file), NameNode identifies the data nodes to which the data blocks need to be replicated and initiates the replication.
  • When the replication factor is reduced (At the cluster level or for a particular file), NameNode identifies the data nodes from which the data blocks need to be deleted and initiates the deletion.

General

Here are few general highlights about HDFS.
  • HDFS is implemented in Java and any computer which can run Java can host a NameNode/DataNode on it.
  • Designed to be portable across all the major hardware and software platforms.
  • Basic file operations include reading and writing of files, creation, deletion, and replication of files, etc.
  • Provides necessary interfaces which enable the movement of computation to the data unlike in traditional data processing systems where the data moves to computation.
  • HDFS provides a command line interface called "FS Shell" used to interact with HDFS.

When to Use HDFS (HDFS Use Cases)

There are many use cases for HDFS including the following:
  • HDFS can be used for storing the Big Data sets for further processing.
  • HDFS can be used for storing archive data since it is cheaper as HDFS allows storing the data on low cost commodity hardware while ensuring a high degree of fault-tolerance.

When Not to Use HDFS

There are certain scenarios in which HDFS may not be a good fit including the following:
  • HDFS is not suitable for storing data related to applications requiring low latency data access.
  • HDFS is not suitable for storing a large number of small files as the metadata for each file needs to be stored on the NameNode and is held in memory.
  • HDFS is not suitable for scenarios requiring multiple/simultaneous writes to the same file.

References

Next Steps

  • Explore more about Big Data and Hadoop
    • Big Data Basics - Part 1 - Introduction to Big Data
    • Big Data Basics - Part 2 - Overview of Big Data Architecture
    • Big Data Basics - Part 3 - Overview of Hadoop
    • Compare Big Data Platforms vs SQL Server
  • In the next and subsequent tips, we will look at the other aspects of Hadoop and the Big Data world. So stay tuned!


Big Data Basics - Part 3 - Overview of Hadoop

Big Data Basics - Part 3 - Overview of Hadoop

Problem

I have read the previous tips on Introduction to Big Data and Architecture of Big Data and I would like to know more about Hadoop.  What are the core components of the Big Data ecosystem? Check out this tip to learn more.

Solution

Before we look into the architecture of Hadoop, let us understand what Hadoop is and a brief history of Hadoop.

What is Hadoop?

Hadoop is an open source framework, from the Apache foundation, capable of processing large amounts of heterogeneous data sets in a distributed fashion across clusters of commodity computers and hardware using a simplified programming model. Hadoop provides a reliable shared storage and analysis system.

The Hadoop framework is based closely on the following principle:
In pioneer days they used oxen for heavy pulling, and when one ox couldn't budge a log, they didn't try to grow a larger ox. We shouldn't be trying for bigger computers, but for more systems of computers. ~Grace Hopper

History of Hadoop

Hadoop was created by Doug Cutting and Mike Cafarella. Hadoop has originated from an open source web search engine called "Apache Nutch", which is part of another Apache project called "Apache Lucene", which is a widely used open source text search library.

The name Hadoop is a made-up name and is not an acronym. According to Hadoop's creator Doug Cutting, the name came about as follows.

"The name my kid gave a stuffed yellow elephant. Short, relatively easy to spell and pronounce, meaningless, and not used elsewhere: those are my naming criteria. Kids are good at generating such. Googol is a kid's term."

Architecture of Hadoop

Below is a high-level architecture of multi-node Hadoop Cluster.

Architecture of Multi-Node Hadoop Cluster

Here are few highlights of the Hadoop Architecture:
  • Hadoop works in a master-worker / master-slave fashion.
  • Hadoop has two core components: HDFS and MapReduce.
  • HDFS (Hadoop Distributed File System) offers a highly reliable and distributed storage, and ensures reliability, even on a commodity hardware, by replicating the data across multiple nodes. Unlike a regular file system, when data is pushed to HDFS, it will automatically split into multiple blocks (configurable parameter) and stores/replicates the data across various datanodes. This ensures high availability and fault tolerance.
  • MapReduce offers an analysis system which can perform complex computations on large datasets. This component is responsible for performing all the computations and works by breaking down a large complex computation into multiple tasks and assigns those to individual worker/slave nodes and takes care of coordination and consolidation of results.
  • The master contains the Namenode and Job Tracker components.
    • Namenode holds the information about all the other nodes in the Hadoop Cluster, files present in the cluster, constituent blocks of files and their locations in the cluster, and other information useful for the operation of the Hadoop Cluster.
    • Job Tracker keeps track of the individual tasks/jobs assigned to each of the nodes and coordinates the exchange of information and results.
  • Each Worker / Slave contains the Task Tracker and a Datanode components.
    • Task Tracker is responsible for running the task / computation assigned to it.
    • Datanode is responsible for holding the data.
  • The computers present in the cluster can be present in any location and there is no dependency on the location of the physical server.

Characteristics of Hadoop

Here are the prominent characteristics of Hadoop:
  • Hadoop provides a reliable shared storage (HDFS) and analysis system (MapReduce).
  • Hadoop is highly scalable and unlike the relational databases, Hadoop scales linearly. Due to linear scale, a Hadoop Cluster can contain tens, hundreds, or even thousands of servers.
  • Hadoop is very cost effective as it can work with commodity hardware and does not require expensive high-end hardware.
  • Hadoop is highly flexible and can process both structured as well as unstructured data.
  • Hadoop has built-in fault tolerance. Data is replicated across multiple nodes (replication factor is configurable) and if a node goes down, the required data can be read from another node which has the copy of that data. And it also ensures that the replication factor is maintained, even if a node goes down, by replicating the data to other available nodes.
  • Hadoop works on the principle of write once and read multiple times.
  • Hadoop is optimized for large and very large data sets. For instance, a small amount of data like 10 MB when fed to Hadoop, generally takes more time to process than traditional systems.

When to Use Hadoop (Hadoop Use Cases)

Hadoop can be used in various scenarios including some of the following:
  • Analytics
  • Search
  • Data Retention
  • Log file processing
  • Analysis of Text, Image, Audio, & Video content
  • Recommendation systems like in E-Commerce Websites

When Not to Use Hadoop

There are few scenarios in which Hadoop is not the right fit. Following are some of them:
  • Low-latency or near real-time data access.
  • If you have a large number of small files to be processed. This is due to the way Hadoop works. Namenode holds the file system metadata in memory and as the number of files increases, the amount of memory required to hold the metadata increases.
  • Multiple writes scenario or scenarios requiring arbitrary writes or writes between the files.
For more information on Hadoop framework and the features of the latest Hadoop release, visit the Apache Website: http://hadoop.apache.org.
There are few other important projects in the Hadoop ecosystem and these projects help in operating/managing Hadoop, Interacting with Hadoop, Integrating Hadoop with other systems, and Hadoop Development. We will take a look at these items in the subsequent tips.
Next Steps
  • Explore more about Big Data and Hadoop
  • In the next and subsequent tips, we will see what is HDFS, MapReduce, and other aspects of Big Data world. So stay tuned!


Big Data Basics - Part 2 - Overview of Big Data Architecture

Big Data Basics - Part 2 - Overview of Big Data Architecture

Problem

I read the tip on Introduction to Big Data and would like to know more about how Big Data architecture looks in an enterprise, what are the scenarios in which Big Data technologies are useful, and any other relevant information.

Solution

In this tip, let us take a look at the architecture of a modern data processing and management system involving a Big Data ecosystem, a few use cases of Big Data, and also some of the common reasons for the increasing adoption of Big Data technologies.

Architecture

Before we look into the architecture of Big Data, let us take a look at a high level architecture of a traditional data processing management system. It looks as shown below.

Traditional Data Processing and Management Architecture

As we can see in the above architecture, mostly structured data is involved and is used for Reporting and Analytics purposes. Although there are one or more unstructured sources involved, often those contribute to a very small portion of the overall data and hence are not represented in the above diagram for simplicity. However, in the case of Big Data architecture, there are various sources involved, each of which is comes in at different intervals, in different formats, and in different volumes. Below is a high level architecture of an enterprise data management system with a Big Data engine.

Big Data Processing and Management Architecture
Let us take a look at various components of this modern architecture.

Source Systems

As discussed in the previous tip, there are various different sources of Big Data including Enterprise Data, Social Media Data, Activity Generated Data, Public Data, Data Archives, Archived Files, and other Structured or Unstructured sources.

Transactional Systems

In an enterprise, there are usually one or more Transactional/OLTP systems which act as the backend databases for the enterprise's mission critical applications. These constitute the transactional systems represented above.

Data Archive

Data Archive is collection of data which includes the data archived from the transactional systems in compliance with an organization's data retention and data governance policies, and aggregated data (which is less likely to be needed in the near future) from a Big Data engine etc.

ODS

Operational Data Store is a consolidated set of data from various transactional systems. This acts as a staging data hub and can be used by a Big Data Engine as well as for feeding the data into Data Warehouse, Business Intelligence, and Analytical systems.

Big Data Engine

This is the heart of modern (Next-Generation / Big Data) data processing and management system architecture. This engine capable of processing large volumes of data ranging from a few Megabytes to hundreds of Terabytes or even Petabytes of data of different varieties, structured or unstructured, coming in at different speeds and/or intervals. This engine consists primarily of a Hadoop framework, which allows distributed processing of large heterogeneous data sets across clusters of computers. This framework consists of two main components, namely HDFS and MapReduce. We will take a closer look at this framework and its components in the next and subsequent tips.

Big Data Use Cases

Big Data technologies can solve the business problems in a wide range of industries. Below are a few use cases.
  • Banking and Financial Services
    • Fraud Detection to detect the possible fraud or suspicious transactions in Accounts, Credit Cards, Debit Cards, and Insurance etc.
  • Retail
    • Targeting customers with different discounts, coupons, and promotions etc. based on demographic data like gender, age group, location, occupation, dietary habits, buying patterns, and other information which can be useful to differentiate/categorize the customers.
  • Marketing
    • Specifically outbound marketing can make use of customer demographic information like gender, age group, location, occupation, and dietary habits, customer interests/preferences usually expressed in the form of comments/feedback and on social media networks.
    • Customer's communication preferences can be identified from various sources like polls, reviews, comments/feedback, and social media etc. and can be used to target customers via different channels like SMS, Email, Online Stores, Mobile Applications, and Retail Stores etc.
  • Sentiment Analysis
    • Organizations use the data from social media sites like Facebook, Twitter etc. to understand what customers are saying about the company, its products, and services. This type of analysis is also performed to understand which companies, brands, services, or technologies people are talking about.
  • Customer Service
    • IT Services and BPO companies analyze the call records/logs to gain insights into customer complaints and feedback, call center executive response/ability to resolve the ticket, and to improve the overall quality of service.
    • Call center data from telecommunications industries can be used to analyze the call records/logs and optimize the price, and calling, messaging, and data plans etc.
Apart from these, Big Data technologies/solutions can solve the business problems in other industries like Healthcare, Automobile, Aeronautical, Gaming, and Manufacturing etc.

Big Data Adoption

Data has always been there and is growing at a rapid pace. One question being asked quite often is "Why are organizations taking interest in the silos of data, which otherwise was not utilized effectively in the past, and embracing Big Data technologies today?". The reason for adoption of Big Data technologies is due to various factors including the following:
  • Cost Factors
    • Availability of Commodity Hardware
    • Availability of Open Source Operating Systems
    • Availability of Cheaper Storage
    • Availability of Open Source Tools/Software
  • Business Factors
    • There is lot of data being generated outside the enterprise and organizations are compelled to consume that data to stay ahead of the competition. Often organizations are interested in a subset of this large volume of data.
    • The volume of structured and unstructured data being generated in the enterprise is very large and cannot be effectively handled using the traditional data management and processing tools.
References
Next Steps
  • Explore more Big Data use cases
  • Stay tuned for next tips in this series to learn more about Big Data ecosystem


Big Data Basics - Part 1 - Introduction to Big Data

Big Data Basics - Part 1 - Introduction to Big Data

Problem

I have been hearing the term Big Data for a while now and would like to know more about it. Can you explain what this term means, how it evolved, and how we identify Big Data and any other relevant details?

Solution

Big Data has been a buzz word for quite some time now and it is catching popularity faster than pretty much anything else in the technology world. In this tip, let us understand what this buzz word is all about, what is its significance, why you should care about it, and more.

What is Big Data?

Wikipedia defines "Big Data" as a collection of data sets so large and complex that it becomes difficult to process using on-hand database management tools or traditional data processing applications.
In simple terms, "Big Data" consists of very large volumes of heterogeneous data that is being generated, often, at high speeds.  These data sets cannot be managed and processed using traditional data management tools and applications at hand.  Big Data requires the use of a new set of tools, applications and frameworks to process and manage the data.

Evolution of Data / Big Data

Data has always been around and there has always been a need for storage, processing, and management of data, since the beginning of human civilization and human societies. However, the amount and type of data captured, stored, processed, and managed depended then and even now on various factors including the necessity felt by humans, available tools/technologies for storage, processing, management, effort/cost, ability to gain insights into the data, make decisions, and so on.
Going back a few centuries, in the ancient days, humans used very primitive ways of capturing/storing data like carving on stones, metal sheets, wood, etc. Then with new inventions and advancements a few centuries in time, humans started capturing the data on paper, cloth, etc. As time progressed, the medium of capturing/storage/management became punching cards followed by magnetic drums, laser disks, floppy disks, magnetic tapes, and finally today we are storing data on various devices like USB Drives, Compact Discs, Hard Drives, etc.
In fact the curiosity to capture, store, and process the data has enabled human beings to pass on knowledge and research from one generation to the next, so that the next generation does not have to re-invent the wheel.
As we can clearly see from this trend, the capacity of data storage has been increasing exponentially, and today with the availability of the cloud infrastructure, potentially one can store unlimited amounts of data. Today Terabytes and Petabytes of data is being generated, captured, processed, stored, and managed.

Characteristics of Big Data - The Three V's of Big Data

When do we say we are dealing with Big Data? For some people 1TB might seem big, for others 10TB might be big, for others 100GB might be big, and something else for others. This term is qualitative and it cannot really be quantified. Hence we identify Big Data by a few characteristics which are specific to Big Data. These characteristics of Big Data are popularly known as Three V's of Big Data.
The three v's of Big Data are Volume, Velocity, and Variety as shown below.
Characteristics of Big Data - The Three V's of Big Data

Volume

Volume refers to the size of data that we are working with. With the advancement of technology and with the invention of social media, the amount of data is growing very rapidly.  This data is spread across different places, in different formats, in large volumes ranging from Gigabytes to Terabytes, Petabytes, and even more. Today, the data is not only generated by humans, but large amounts of data is being generated by machines and it surpasses human generated data. This size aspect of data is referred to as Volume in the Big Data world.

Velocity

Velocity refers to the speed at which the data is being generated. Different applications have different latency requirements and in today's competitive world, decision makers want the necessary data/information in the least amount of time as possible.  Generally, in near real time or real time in certain scenarios. In different fields and different areas of technology, we see data getting generated at different speeds. A few examples include trading/stock exchange data, tweets on Twitter, status updates/likes/shares on Facebook, and many others. This speed aspect of data generation is referred to as Velocity in the Big Data world.

Variety

Variety refers to the different formats in which the data is being generated/stored. Different applications generate/store the data in different formats. In today's world, there are large volumes of unstructured data being generated apart from the structured data getting generated in enterprises. Until the advancements in Big Data technologies, the industry didn't have any powerful and reliable tools/technologies which can work with such voluminous unstructured data that we see today. In today's world, organizations not only need to rely on the structured data from enterprise databases/warehouses, they are also forced to consume lots of data that is being generated both inside and outside of the enterprise like clickstream data, social media, etc. to stay competitive. Apart from the traditional flat files, spreadsheets, relational databases etc., we have a lot of unstructured data stored in the form of images, audio files, video files, web logs, sensor data, and many others. This aspect of varied data formats is referred to as Variety in the Big Data world.

Sources of Big Data

Just like the data storage formats have evolved, the sources of data have also evolved and are ever expanding.  There is a need for storing the data into a wide variety of formats. With the evolution and advancement of technology, the amount of data that is being generated is ever increasing. Sources of Big Data can be broadly classified into six different categories as shown below.
Sources of Big Data

Enterprise Data

There are large volumes of data in enterprises in different formats. Common formats include flat files, emails, Word documents, spreadsheets, presentations, HTML pages/documents, pdf documents, XMLs, legacy formats, etc. This data that is spread across the organization in different formats is referred to as Enterprise Data.

Transactional Data

Every enterprise has some kind of applications which involve performing different kinds of transactions like Web Applications, Mobile Applications, CRM Systems, and many more. To support the transactions in these applications, there are usually one or more relational databases as a backend infrastructure. This is mostly structured data and is referred to as Transactional Data.

Social Media

This is self-explanatory. There is a large amount of data getting generated on social networks like Twitter, Facebook, etc. The social networks usually involve mostly unstructured data formats which includes text, images, audio, videos, etc. This category of data source is referred to as Social Media.

Activity Generated

There is a large amount of data being generated by machines which surpasses the data volume generated by humans. These include data from medical devices, censor data, surveillance videos, satellites, cell phone towers, industrial machinery, and other data generated mostly by machines. These types of data are referred to as Activity Generated data.

Public Data

This data includes data that is publicly available like data published by governments, research data published by research institutes, data from weather and meteorological departments, census data, Wikipedia, sample open source data feeds, and other data which is freely available to the public. This type of publicly accessible data is referred to as Public Data.

Archives

Organizations archive a lot of data which is either not required anymore or is very rarely required. In today's world, with hardware getting cheaper, no organization wants to discard any data, they want to capture and store as much data as possible. Other data that is archived includes scanned documents, scanned copies of agreements, records of ex-employees/completed projects, banking transactions older than the compliance regulations.  This type of data, which is less frequently accessed, is referred to as Archive Data.

Formats of Data

Data exists in multiple different formats and the data formats can be broadly classified into two categories - Structured Data and Unstructured Data.
Structured data refers to the data which has a pre-defined data model/schema/structure and is often either relational in nature or is closely resembling a relational model. Structured data can be easily managed and consumed using the traditional tools/techniques. Unstructured data on the other hand is the data which does not have a well-defined data model or does not fit well into the relational world.
Structured data includes data in the relational databases, data from CRM systems, XML files etc. Unstructured data includes flat files, spreadsheets, Word documents, emails, images, audio files, video files, feeds, PDF files, scanned documents, etc.

Big Data Statistics

  • 100 Terabytes of data is uploaded to Facebook every day
  • Facebook Stores, Processes, and Analyzes more than 30 Petabytes of user generated data
  • Twitter generates 12 Terabytes of data every day
  • LinkedIn processes and mines Petabytes of user data to power the "People You May Know" feature
  • YouTube users upload 48 hours of new video content every minute of the day
  • Decoding of the human genome used to take 10 years. Now it can be done in 7 days
  • 500+ new websites are created every minute of the day
Source: Wikibon - A Comprehensive List of Big Data Statistics
In this tip we were introduced to Big Data, how it evolved, what are its primary characteristics, what are the sources of data, and a few statistics showing how large volumes of heterogeneous data is being generated at different speeds.
References
Next Steps
  • Explore more about Big Data.  Do some of your own searches to see what you can find.
  • Stay tuned for future tips in this series to learn more about the Big Data ecosystem.


BigData Challenges

BigData Challenges

The Data Science Process

A data science project may begin with a very well-defined question  -- Which of these 200 genetic markers are the best predictors of disease X? -- or an open-ended one -- How can we  decrease emergency room wait time in a hospital? Either way, once the motivating question has been identified, a data science project progresses through five iterative stages:

  • Harvest Data: Find and choose data sources
  • Clean Data: Load data into pre-processing environment; prep data for analysis
  • Analysis: Develop and execute the actual analysis
  • Visualize: Display the results in ways that effectively communicate new insights, or point out where the analysis needs to be further developed
  • Publish: Deliver the results to their intended recipient, whether human or machine
Each of these stages is associated with its own challenges, and correspondingly, with a plethora of tools that have sprung up to address those particular challenges.  Data science is an iterative process; at any stage, it may be necessary to circle back to earlier stages in order to incorporate new data or revise models.

Below is an outline of challenges that arise in each stage; it is meant to give the reader a sense of the scale and complexity of such challenges, not to enumerate them exhaustively:

Challenges of stage 1: Harvest Data


This is a classic needle-in-a-haystack problem: there exist millions of available data sets in the world, and of those only a handful are suitable, much less accessible, for a particular project. The exact criteria for what counts as "suitable data" will vary from project to project, but even when the criteria are fairly straightforward, finding data sets and proving that they meet those criteria can be a complex and time-consuming process.

When dealing with public data, the data sets are scattered and often poorly described. Organizations ranging from the federal government to universities to companies have begun to publish and/or curate large public data sets, but this is a fairly new practice, and there is much room for improvement. Dealing with internal data is not any easier: within an enterprise, there can be multiple data warehouses belonging to different departments, each contributed to by multiple users with little integration or uniformity across warehouses.

In addition to format and content, metadata, particularly provenance information, is crucial: the history of a data set, who produced it, how it was produced, when it was last updated, etc. also determine how suitable a data set is for a given project. However, this information is not often tracked and/or stored with the data, and if it is, it may be incomplete or manually generated.

Challenges of stage 2: Cleanse/Prep Data


This stage can require operations as simple as visually inspecting samples of the data to ones as complex as transforming the entire data set. Format and content are two major areas of concern.

With respect to format, data comes in a variety of formats, from highly structured (relational) to unstructured (photos, text documents) to anything in between (XML, CSVs), and these formats may not play well together. The user may need to write custom code in order to convert the data sets to compatible formats, use programming languages or purpose-built software, or even manually manipulate the data in programs like Excel.  This latter path becomes a non-option once the data set exceeds a certain size.

With respect to content and data quality, there are numerous criteria to consider, but  some major ones are accuracy, internal consistency, and compliance with applicable regulations (e.g. privacy laws, internal policies). The same data may be stored in different ways across data sets (e.g. multiple possible formats for date/time information), or the data set may have multiple "parent" data sets whose content must meet the same criteria.

In the Hadoop ecosystem, one common tool for initially inspecting and prepping data is Hive. Hive is commonly used for ad-hoc querying and data summarization, and in this context, Hive's strengths are its familiar SQL-like  query language (HiveQL) and its ability to handle both structured and semi-structured data.

However, Hive lacks the functional flexibility needed for significantly transforming raw data into a form more fitting for the planned analysis, often a standard part of the "data munging" process. Outside of Hadoop, data scientists use languages such as R, Python or Perl to execute these transformations, but these tools are limited to the processing power of the machines - often the users' own laptops - on which they are installed.

Challenges of stage 3: Analyze


Once the data is prepared, there is often a "scene change;" that is, the analytics take place in an environment different from the pre-processing environment. For instance, the latter may be a data warehouse while the former is a desktop application. This can prove to be another logistical challenge, particularly if the pre-processing environment has a greater capacity than the analytical one.

This stage is where data science most clearly borrows from, or is an extension of, statistics. It requires starting with data, forming a hypothesis about what that data says about a given slice of reality, formally modelling that hypothesis, running data through the model, observing the results, refining the hypothesis, refining the model and repeating. Having specialist-level knowledge of the relevant sector or field of study is also very helpful; on the other hand, there is also a risk of confirmation bias if one's background knowledge is given undue weight over what the numbers say.

Given that data sets can contain up to thousands of variables and millions or billions of records, performing data science on these very large data sets often calls for approaches such as machine learning and data mining. Both involve programs based on statistical principles that can complete tasks and answer questions without explicit human direction, usually by means of pattern recognition. Machine learning is defined by algorithms and performance metrics enabling programs to interpret new data in the context of historical data and continuously revise predictions.

A machine learning program is typically aimed at answering a specific question about a data set with generally known characteristics, all with minimal human interaction. In contrast, data mining is defined by the need to discover previously unknown features of a data set that may be especially large and unstructured. In this case, the task or question is less specific, and a program may require more explicit direction from the human data scientist to reveal useful features of the data.

Challenges of stage 4: Visualize


Visualization is necessary for both the "Analyze" and "Publish" stages, though it plays slightly different roles in each:
In the former, the data scientist uses visualization to more easily see the results of each round of testing. Graphics at this stage are often bare-bones and simple: scatterplots, histograms, etc. - but effectively capture feedback for the data scientist on what the latest round of modeling and testing indicates.

In the latter, the emphasis is often on interactiveness and intuitive graphics, so that the data products can be used as effectively as possible by the end users. For example, if a data science project's goal is to mine hospital data for insights on how the hospital can ensure continuity in the medical team assigned to a patients throughout their stay, it is not the data scientist's job to predict all the exact situations in which the doctors will use the results of analysis. Rather, the goal of visualization in this case is to expose facets of the data in a way that is intuitive to the user and still gives them flexibility; i.e. does not lock them into one view or use of the data.

The emphasis on visualization in data science is a result of the same factors that have produced the increased demand for data science itself: the scale and complexity of available data has grown to a point where useful insights do not lie in plain view but must be unearthed, polished, and displayed to their best advantage. Visualization is a key part of accomplishing those goals.

Challenges of stage 5: Publish


This stage could also be called "Implementation." The potential challenges here are as varied as the potential goals of the use case. A data science project could be part of product development for a smartphone app, in which case the intended recipient of the output could be either the app designers, or could be supporting an already-deployed app.

Similarly, a data science project could be used by financial firms to inform investment decision-making, in which case the recipient could be either a piece of automated trading software or a team of brokers. Suffice it to say that data scientists will need to be concerned with many of the same features of the output data sets as they were with the input data sets - format, content, provenance - and that a data scientist's mastery of the data also involves knowing how to best present it, whether to machines or to humans.

BigData Success Stories

BigData Success Stories

Every company, in particular large large enterprises, faces both great opportunities and challenges with respect to extracting value from the data available to them. In each of the following notable examples, organizations have used data science to craft solutions to pressing problems, a process which in turn opens up more opportunities and challenges.

"Moneyball"


One of the best-known examples of data science, due to a best-selling book and recent film, is the collective movement in baseball toward intensive statistical analysis of player performance to complement traditional appraisals. Led by the works of baseball analyst Bill James, and ultimately by management decisions of Oakland Athletics' manager Billy Beane, teams discovered that some players were undervalued by traditional metrics. Since Boston hired James in 2003, the Red Sox have won two World Series, following more than 80 years without a title.
Among sports, baseball presented an especially rich opportunity for analysis, given access to meticulous records for many games dating back to over one hundred years ago. Today other sports organizations, such as the NBA, have begun to apply some of the same techniques.


Get Out the Vote 2012


In the 2012 presidential election, both campaigns supported get-out-the-vote activities with intricate polling, data mining, and statistical analysis. In the Obama campaign, this analytics effort was code-named Narwhal, while the Romney campaign dubbed theirs Orca. The aim of these systems, described by Atlantic Monthly and other sources, was to identify voters inclined to vote for the candidate, convince the individual to vote for the candidate of the party in question, and direct resources to ensure the individual reached the polling place on Election Day. Reportedly, Narwhal had a capacity of 175 million names and employed more than 120 data scientists. Orca was comparatively small, with a capacity of 23 million names.

Ultimately, Narwhal is credited with having delivered for the Obama campaign "ground game" in battleground states, turning a seemingly close election into a comfortable victory and validating many polls that had predicted a small but consistent advantage for the incumbent.

Additional Links


The "Like" Button


In 2010, the social networking company sought to determine whether the proposed "like" button would catch on with users and how this link to other websites could drive traffic to the site. The company offered the feature to a small sample of users and collected detailed web logs for those users. This data was processed into structured form (using Hadoop and Hive). Analytics showed that overall content generation increased, even content unrelated to the "like" button.
Aside from the impact of the feature on the Facebook website itself, this feature provides the company with a wealth of information about user behavior across the Internet which can be used to predict reactions to new features and determine the impact of online advertising.

Additional Links


Pregnancy Prediction


In early 2012, the New York Times described a concerted effort by consumer goods giant Target to use purchase records, including both the identity of the purchased items and the temporal distribution of those purchases - to classify customers, particularly pregnant women. Predicting when women were in the early stages of a pregnancy presented the opportunity to gain almost exclusive consumer loyalty for a period when families might want to save time by shopping at a single location. Once individuals were identified by the company's data science team, Target mailed coupons for products often purchased by pregnant women. In one incident, a man called the company to complain that his daughter had received mailings filled with such coupons, and it was unacceptable that the company was encouraging her to become pregnant. Days later, the man called to apologize: Target had, in fact, correctly surmised that his daughter was pregnant.

Additional Links


Open-Source Recommendation Algorithms


For online businesses, making good recommendations to customers is a classic data science challenge. As described by Wired, online retailer Overstock.com used to spend $2 million annually on software to drive recommendations for additional purchases. Last year, Overstock.com's R&D team used machine learning algorithms from Mahout, an open source Hadoop project, to develop a news article recommendation app based on articles that the user had read.
The success of this app inspired the company to use Mahout to replace the recommendation service for products on its own main website. By turning to an open source solution for data science, the company is saving millions of dollars. In addition to Overstock.com, other players in online retail are now taking a close look at Mahout and other Hadoop technologies.

Additional Links


Transparency in Healthcare


An abundance of publicly available data online has stoked further interest in "democratizing" access to information that would help the average citizen understand certain markets. Wired talked to Fred Trotter about his successful Freedom of Information Act (FOIA) request to obtain records on doctor referrals, which could provide insights into the healthcare system. The resulting data set, which he called the Doctor Social Graph, has already been turned into a tool for patients. Trotter hopes to combine this data set with others from healthcare organizations to develop a tool for rating doctors.

Additional Links


Photo Quality Prediction


A travel app startup called JetPac knew they had a problem. They needed to figure out better ways to automatically identify the best pictures among thousands taken by their users, based on metadata such as captions, dimensions, and location. In fall 2011, the company partnered with another start up, Kaggle, to set up a competition among data scientists all over the world to develop an algorithm. The ideal algorithm would allow a machine to come to the same conclusion as a human about the quality of a picture, and the top prize was $5,000.
Building on the highest-ranked algorithm from the competition, JetPac successfully introduced the new functionality into their product. According to Wired, the company subsequently received $2.4 million in venture capital funding. With a little help from the data science community, JetPac is well on its way to building its business.

Additional Links


Energy Efficiency


For almost five years, the DC-based startup Opower has built a business on providing power consumers recommendations on how to reduce their bills. The company's system collects data from 75 utilities on more than 50 million homes, then sends recommendations through email and other means.
Although other companies offer similar services, Opower has been able to scale up significantly using Hadoop to store large amounts of data from power meters across the country. The more data the company can analyze, the greater the opportunity for good recommendations, and the more energy there is to be saved. Success has enabled Opower to develop new offerings in partnership with established companies such as Facebook.

Additional Links


Improving Patient Outcomes


Health insurance giant Aetna was not achieving the desired level of success in addressing symptoms of metabolic syndrome, which is associated with heart disease and strokes. In summer 2012, the company had created an in-house data science team, and the group went to work on the issue. In partnership with an outside lab focused on metabolic syndrome, Aetna used their data on more than 18 million customers to design personalized recommendations for patients suffering from related symptoms.
Aetna intends to harvest additional data available for this kind of analysis by incorporating natural language processing to read notes handwritten by doctors. Ultimately, the company plans to use data science to bring down costs and improve outcomes for cancer patients.

Additional Links


Pre-Paid Phone Service


Every company wants to know the right time to reach out to customers, making sure the message has the maximum impact and avoiding a perception of saturation. A company called Globys is helping large telecommunications corporations understand when to make the pitch. In particular, Globys analyzed data on users of pre-paid phone services, who are not locked into a longer contract. These users face a decision on a regular basis of whether to stay with a particular company or make a change. Globys was able to identify the right time in the user's "recharge cycle" for the company to reach out. With these recommendations, companies have seen revenue from pre-paid services increase up to 50 percent.

Additional Links

Related Posts Plugin for WordPress, Blogger...